This adds support for generating Chrome-tracing .json profile traces in the LLD COFF driver. Also add the necessary time scopes, so that the profile trace shows in great detail which tasks are executed. As an example, this is what we see when linking a Unreal Engine executable: 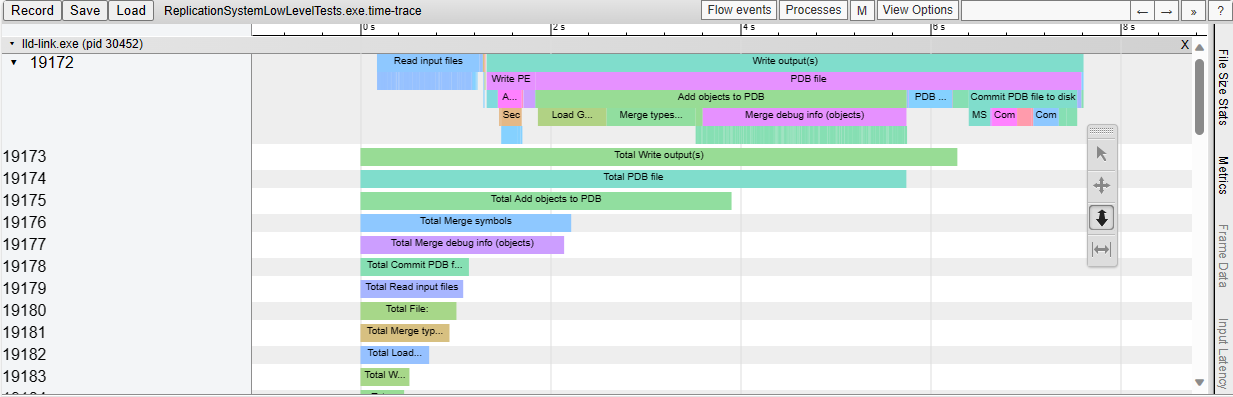
45 lines
1.4 KiB
ArmAsm
45 lines
1.4 KiB
ArmAsm
# REQUIRES: x86
|
|
|
|
# RUN: llvm-mc -triple=x86_64-windows-msvc -filetype=obj -o %t.obj %s
|
|
|
|
# Test implicit trace file name
|
|
# RUN: lld-link %t.obj /entry:main /out:%t1.exe --time-trace --time-trace-granularity=0
|
|
# RUN: cat %t1.exe.time-trace \
|
|
# RUN: | %python -c 'import json, sys; json.dump(json.loads(sys.stdin.read()), sys.stdout, sort_keys=True, indent=2)' \
|
|
# RUN: | FileCheck %s
|
|
|
|
# Test specified trace file name
|
|
# RUN: lld-link %t.obj /entry:main /out:%t2.exe --time-trace=%t2.json --time-trace-granularity=0
|
|
# RUN: cat %t2.json \
|
|
# RUN: | %python -c 'import json, sys; json.dump(json.loads(sys.stdin.read()), sys.stdout, sort_keys=True, indent=2)' \
|
|
# RUN: | FileCheck %s
|
|
|
|
# Test trace requested to stdout
|
|
# RUN: env LLD_IN_TEST=1 lld-link %t.obj /entry:main /out:%t3.exe --time-trace=- --time-trace-granularity=0 \
|
|
# RUN: | %python -c 'import json, sys; json.dump(json.loads(sys.stdin.read()), sys.stdout, sort_keys=True, indent=2)' \
|
|
# RUN: | FileCheck %s
|
|
|
|
# CHECK: "beginningOfTime": {{[0-9]{16},}}
|
|
# CHECK-NEXT: "traceEvents": [
|
|
|
|
# Check one event has correct fields
|
|
# CHECK: "dur":
|
|
# CHECK-NEXT: "name":
|
|
# CHECK-NEXT: "ph":
|
|
# CHECK-NEXT: "pid":
|
|
# CHECK-NEXT: "tid":
|
|
# CHECK-NEXT: "ts":
|
|
|
|
# Check there are events
|
|
# CHECK: "name": "Read input files"
|
|
|
|
# Check process_name entry field
|
|
# CHECK: "name": "lld-link{{(.exe)?}}"
|
|
# CHECK: "name": "process_name"
|
|
# CHECK: "name": "thread_name"
|
|
|
|
.text
|
|
.global main
|
|
main:
|
|
ret
|